Model answer:
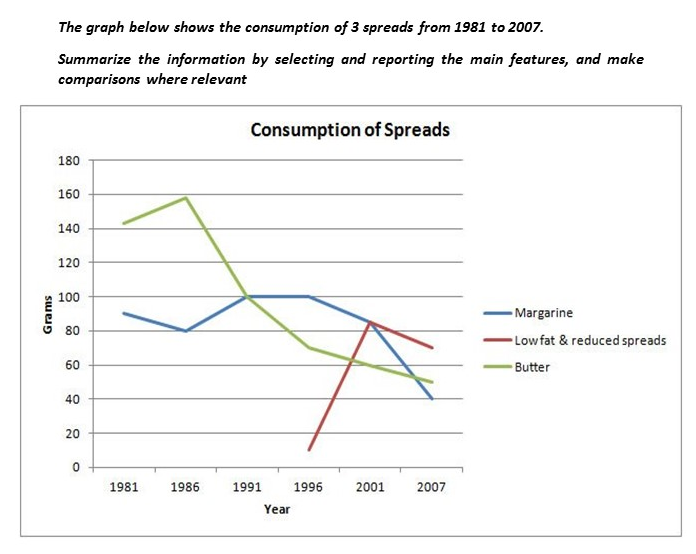
The line graph illustrates the amount of three kinds of spreads (margarine, low fat and reduced spreads and butter) which were consumed over 26 years from 1981 to 2007. Units are measured in grams.
Overall, the consumption of margarine and butter decreased over the period given, while for low fat and reduced spreads, it rose. At the start of the period, butter was the most popular spread, which was replaced by margarine from 1991 to 2001, and following that low fat and reduced spreads became the most widely used spread in the final years.
With regards to the amount of butter used, it began at around 140 grams and then peaked at 160 grams in 1986 before failing dramatically to about 50 grams in the last year. Likewise, approximately 90 grams of margarine was eaten in the first year after which the figure fluctuated slightly and dropped to a low of 40 grams in 2007.
On the other hand, the consumption of low and reduced spreads only started in 1996 at about 10 grams. This figure, which reached a high of just over 80 grams 5 years later, fell slightly in the final years to approximately 70 grams in 2007.
(200 words)