Skip to main content
☰
Expand
You are currently using guest access (
Log in
)
Call us : (84-28) 38245618
E-mail :
onlinesupport@vnseameo.org
Learner Support
Home
Courses
Language Learning
Learner Support
IELTS Writing Task 1 Support
Questions and model answers of Task 1.
092019 - 2 : Task 1 - Pie Chart 1
Search
Search forums
Questions and model answers of Task 1.
092019 - 2 : Task 1 - Pie Chart 1
092019 - 1 : Task 1 - Bar Chart 1
092019 - 3 : Task 1 - Line Graph 1
Display mode
Display replies flat, with oldest first
Display replies flat, with newest first
Display replies in threaded form
Display replies in nested form
092019 - 2 : Task 1 - Pie Chart 1
by
Phương RETRAC_Huỳnh Bảo
- Monday, 30 September 2019, 1:39 PM
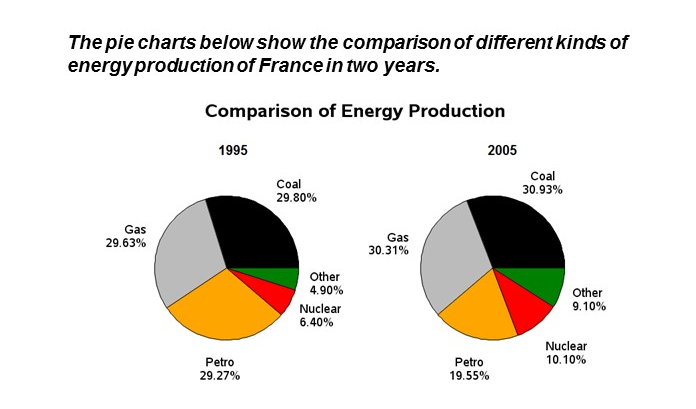
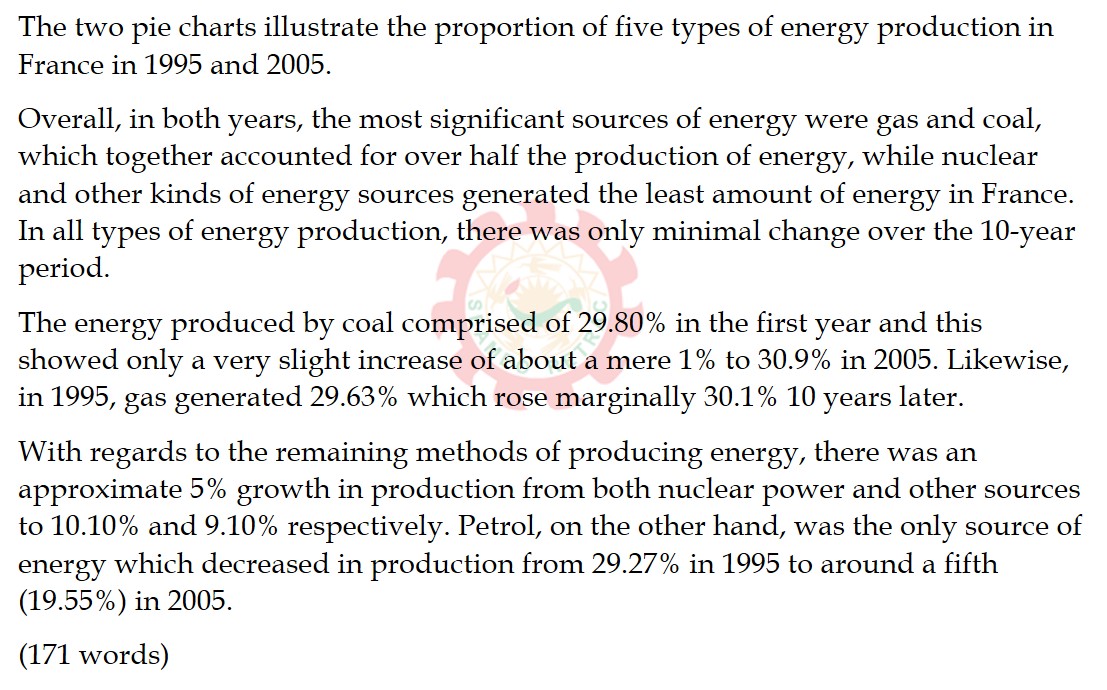
The pie charts below show the comparison of different kinds of energy production in France in two years.
Permalink
|
Reply
092019 - 1 : Task 1 - Bar Chart 1
092019 - 3 : Task 1 - Line Graph 1
Learner Support
Online resources for learning support
EIC (English International Communication)
GE (General English)
English for Specific Skills
IELTS Courses
TOEFL-iBT
One-To-One Courses
IELTS SPEAKING SAMPLE VIDEO
IELTS Speaking materials
IELTS Writing Task 1 Support
IELTS Writing Task 2 Support
IELTS Vocabulary Support with exercises
IELTS Reading Practice
IELTS Listening Preparation
PLACEMENT TEST
IELTS Level 1
IELTS Level 3
Home
Calendar
Get the mobile app