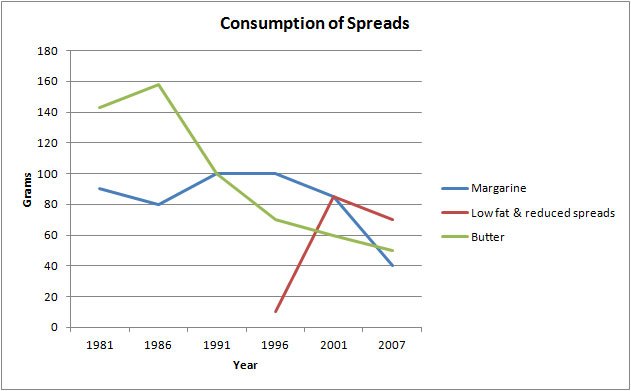
The graph below shows the consumption of 3 spreads from 1981 to 2007.
Summarize the information by selecting and reporting the main features, and make comparisons where relevant.